Is Linear Regression Suitable for Likert Scale Data?
Pros and Cons and Alternative Approaches

One common question I get asked is whether linear regression can be used to model Likert scale survey data. My answer? It depends. Like many decisions in data analysis, whether or not to use linear regression hinges on context: the nature of the data, your analytical goals, and what you hope to achieve. In this post, I’ll break down the pros and cons of using linear regression for Likert scale data and suggest when it makes sense—and when it doesn’t.
Some Background
Linear regression is a widely used statistical tool for modeling relationships between variables. It’s popular due to its simplicity and interpretability. On the other hand, Likert scale data—typically used in surveys to measure attitudes or perceptions—is ordinal in nature. This means it represents ordered categories, but the differences between the categories (e.g., from “Very Dissatisfied” to “Dissatisfied”) are not necessarily equal.
Although it may seem tempting to treat Likert responses as continuous variables for simplicity, this assumption may lead to incorrect conclusions.
The Nature of Likert Scale
Likert scales are ordinal, meaning that while the values represent a rank order, the intervals between points (e.g., between 1 and 2, or 4 and 5) are not guaranteed to be equal. Despite this, analysts often treat Likert data as continuous or numeric for simplicity. While this assumption might sometimes work, it can also introduce problems in interpretation and accuracy.
In summary, there are pros and cons in using Linear Regression for modeling Likert Scale data:
Pros
Linear regression models are straightforward and intuitive, making the relationships between variables easy to understand.
Linear regression can accommodate multivariate analysis, allowing you to explore interaction effects between variables.
Cons:
Ordinal Nature of Likert Data: Linear regression assumes equal distances between data points, which is not guaranteed with ordinal scales like Likert.
Limited Range and Sensitivity to Outliers: The narrow range of Likert scale data (e.g., 1-5) can lead to heteroscedasticity (unequal variance) and reduce the model's explanatory power. Linear regression is highly sensitive to outliers, and this can be particularly problematic when applied to Likert scale data, which has a limited number of response options.
Let’s go through some examples on pros and cons.
Pro: Simplicity and Interpretability
Linear regression offers straightforward interpretability, making it an accessible tool for analyzing relationships between variables. For instance, the coefficient for an independent variable (e.g., age) quantifies its effect on a dependent variable (e.g., satisfaction measured on a Likert scale) as the slope, representing the rate of change in satisfaction for each unit increase in age.
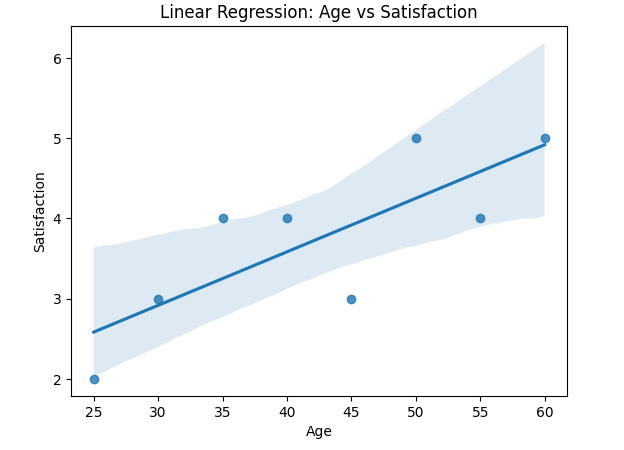
You can visualize the relationship with a scatter plot and a regression line provides an intuitive view of how satisfaction changes with age.
Regression is straightforward to apply, and results like R-squared and adjusted R-squared and p-values are familiar to most audiences.
Pro: Multivariate Analysis and Capturing Interaction Effects
Linear regression is not limited to simple relationships between one dependent variable and one independent variable. It excels in multivariate analysis, where multiple predictors (independent variables) are included to explore how they jointly influence the dependent variable. A particularly powerful feature is the ability to model interaction effects, which help capture how the relationship between one predictor and the outcome depends on another predictor.
Interaction effects allow us to study whether the effect of one variable (e.g., income) on the dependent variable (e.g., satisfaction) changes depending on the value of another variable (e.g., age). This is particularly useful in understanding complex relationships, such as:
How satisfaction with a service varies across income levels for different age groups?
In the example below, assessing interaction effects on age and income can help us get a new takeaway:
40k: Satisfaction decreases with age.
70k: Satisfaction shows a mild upward trend with age.
100k: Satisfaction increases significantly with age.
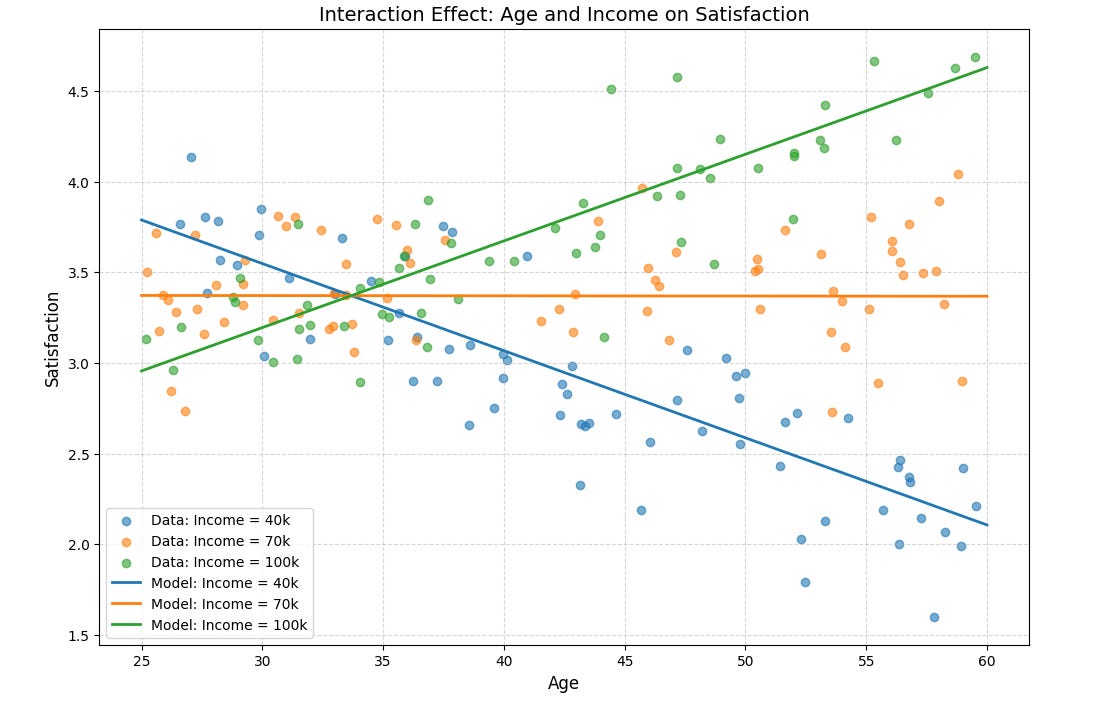
In this example:
Interaction effects can vary across ranges of predictors, especially when combined with non-linear terms. This creates a more nuanced view than simple linear relationships.
The interaction between predictors can lead to different slopes (or even different directions) in the relationship between one predictor and the outcome, depending on the value of the other predictor.
Visualizations are still simple and can help us in understanding these relationships, as numeric summaries alone may not capture their complexity.
Con: Violates Ordinality of Likert Scales
Linear regression assumes that the dependent variable is continuous with equal intervals between values. However, Likert scale responses (e.g., "1: Very Dissatisfied" to "5: Very Satisfied") are ordinal, and the intervals between points are not guaranteed to be equal. For example:
The "distance" between satisfaction levels 1 and 2 may represent a much larger subjective difference than between levels 4 and 5.
This mismatch can lead to misleading results when linear regression is used on Likert scale data.
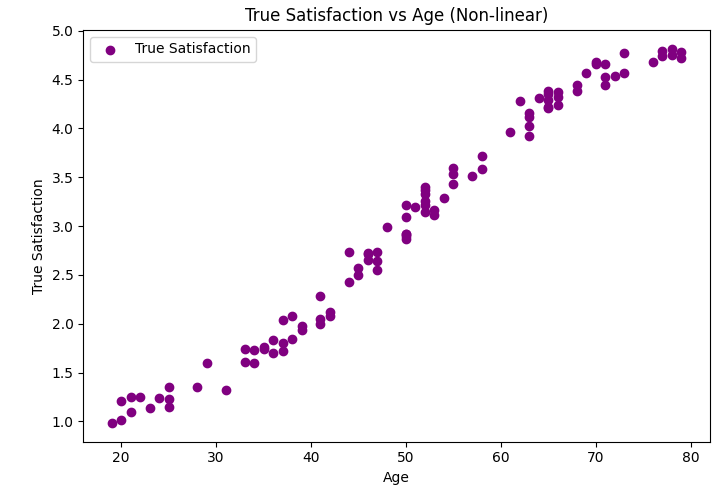
Consider a hypothetical scenario where we treat the Likert scale as if it represents continuous values. Let's assume an underlying "true satisfaction" scale (which doesn't exist, but serves to illustrate the discrepancy):
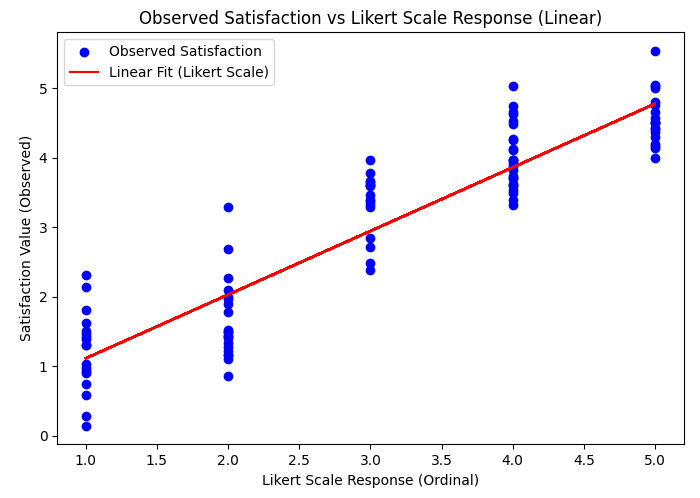
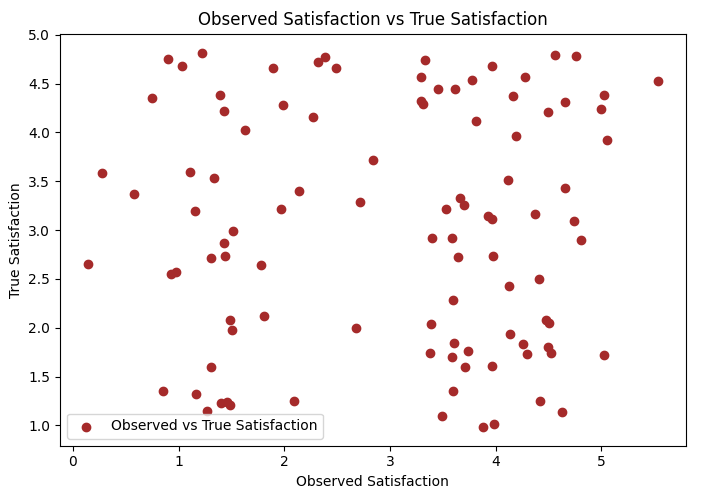
The plots above contrasts two perspectives:
"Assumed Continuous": Linear regression treats the Likert points as equidistant.
"True Ordinal Distances": Reflects the actual unequal intervals between satisfaction levels.
A scatter plot comparing these two perspectives clearly shows the gap between linear assumptions and the true ordinal nature of the data. The pattern in true satisfaction is not linear, emphasizing the risk of assuming equal intervals and the potential bias in coefficient estimates from linear regression.
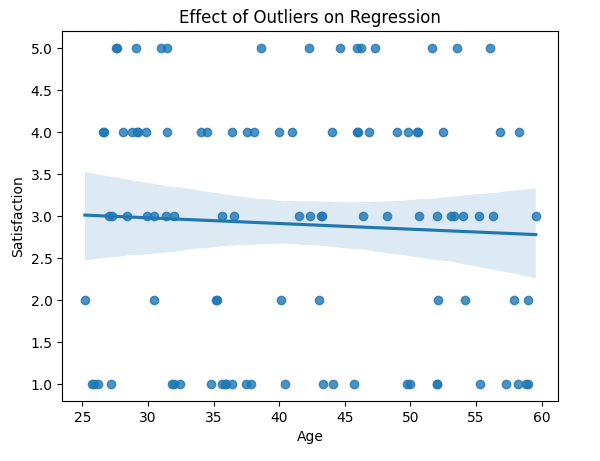
Con: Limited Range and Sensitivity to Outliers
Linear regression is highly sensitive to outliers, and this can be particularly problematic when applied to Likert scale data, which has a limited number of response options. Outliers—responses that deviate significantly from the norm—can disproportionately influence the model, distorting regression coefficients and leading to misleading or inaccurate conclusions. This sensitivity can undermine the reliability of the model, especially when the Likert scale is treated as continuous, as the outliers may not reflect true variations in the underlying data. Here is an example visualization of how a linear regression can lead to misleading results:
Alternative Methods
Ordinal Logistic Regression: This method treats Likert scale responses as ordinal data, modeling the probability of a response falling within or below a specific category. Ordinal logistic regression preserves the ordinal nature of Likert data and provides estimated probabilities for each response category, making it more appropriate than linear regression for such data.
Cumulative Link Models: A generalization of ordinal logistic regression, cumulative link models are commonly used for ordered categorical outcomes. They allow for greater flexibility, including the incorporation of mixed-effects models to account for group-level variability or random effects, improving their applicability to capture relationships with complex underlying data.
Logistic Regression or Classification Methods: When Likert data shows a strongly bimodal distribution, one approach is to transform the Likert scale into binary categories and apply Binary Logistic Regression or tree-based classification models (e.g. Decision Trees, Random Forest, etc.). This method can better capture the underlying structure of highly skewed or bimodal data.
Generalized Additive Models (GAMs): GAMs offer a flexible way to model non-linear relationships between predictors and Likert outcomes, particularly when the data is constrained by a limited response range. They provide a powerful tool for capturing complex, non-linear trends in Likert scale data, making them ideal for more nuanced analyses.
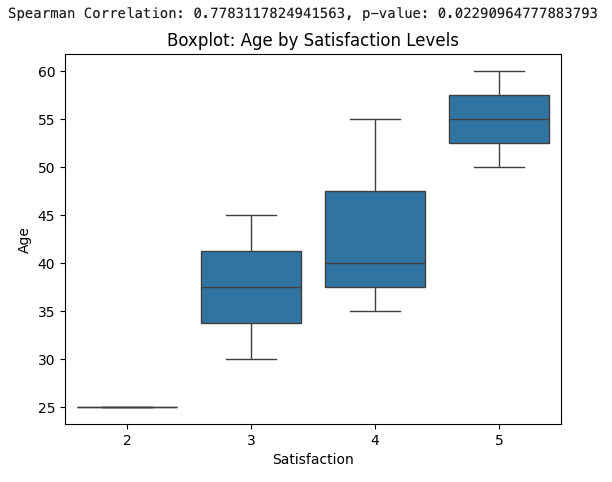
Nonparametric Methods: When the assumptions of parametric tests are violated, nonparametric methods such as Spearman's rank correlation or Kruskal-Wallis tests can be more robust. These methods do not assume normality or equal intervals between responses, making them well-suited for analyzing Likert data, especially when assessing relationships between variables without assuming a specific distribution. An example visualization below:
If you find blog topics like this helpful and have other suggestions in mind, feel free to reach out to me directly with your ideas. I'd love to hear your thoughts and explore new topics together!